
P-HRM-I Technology
1. Evolution of Technology For Pharyngeal Manometry
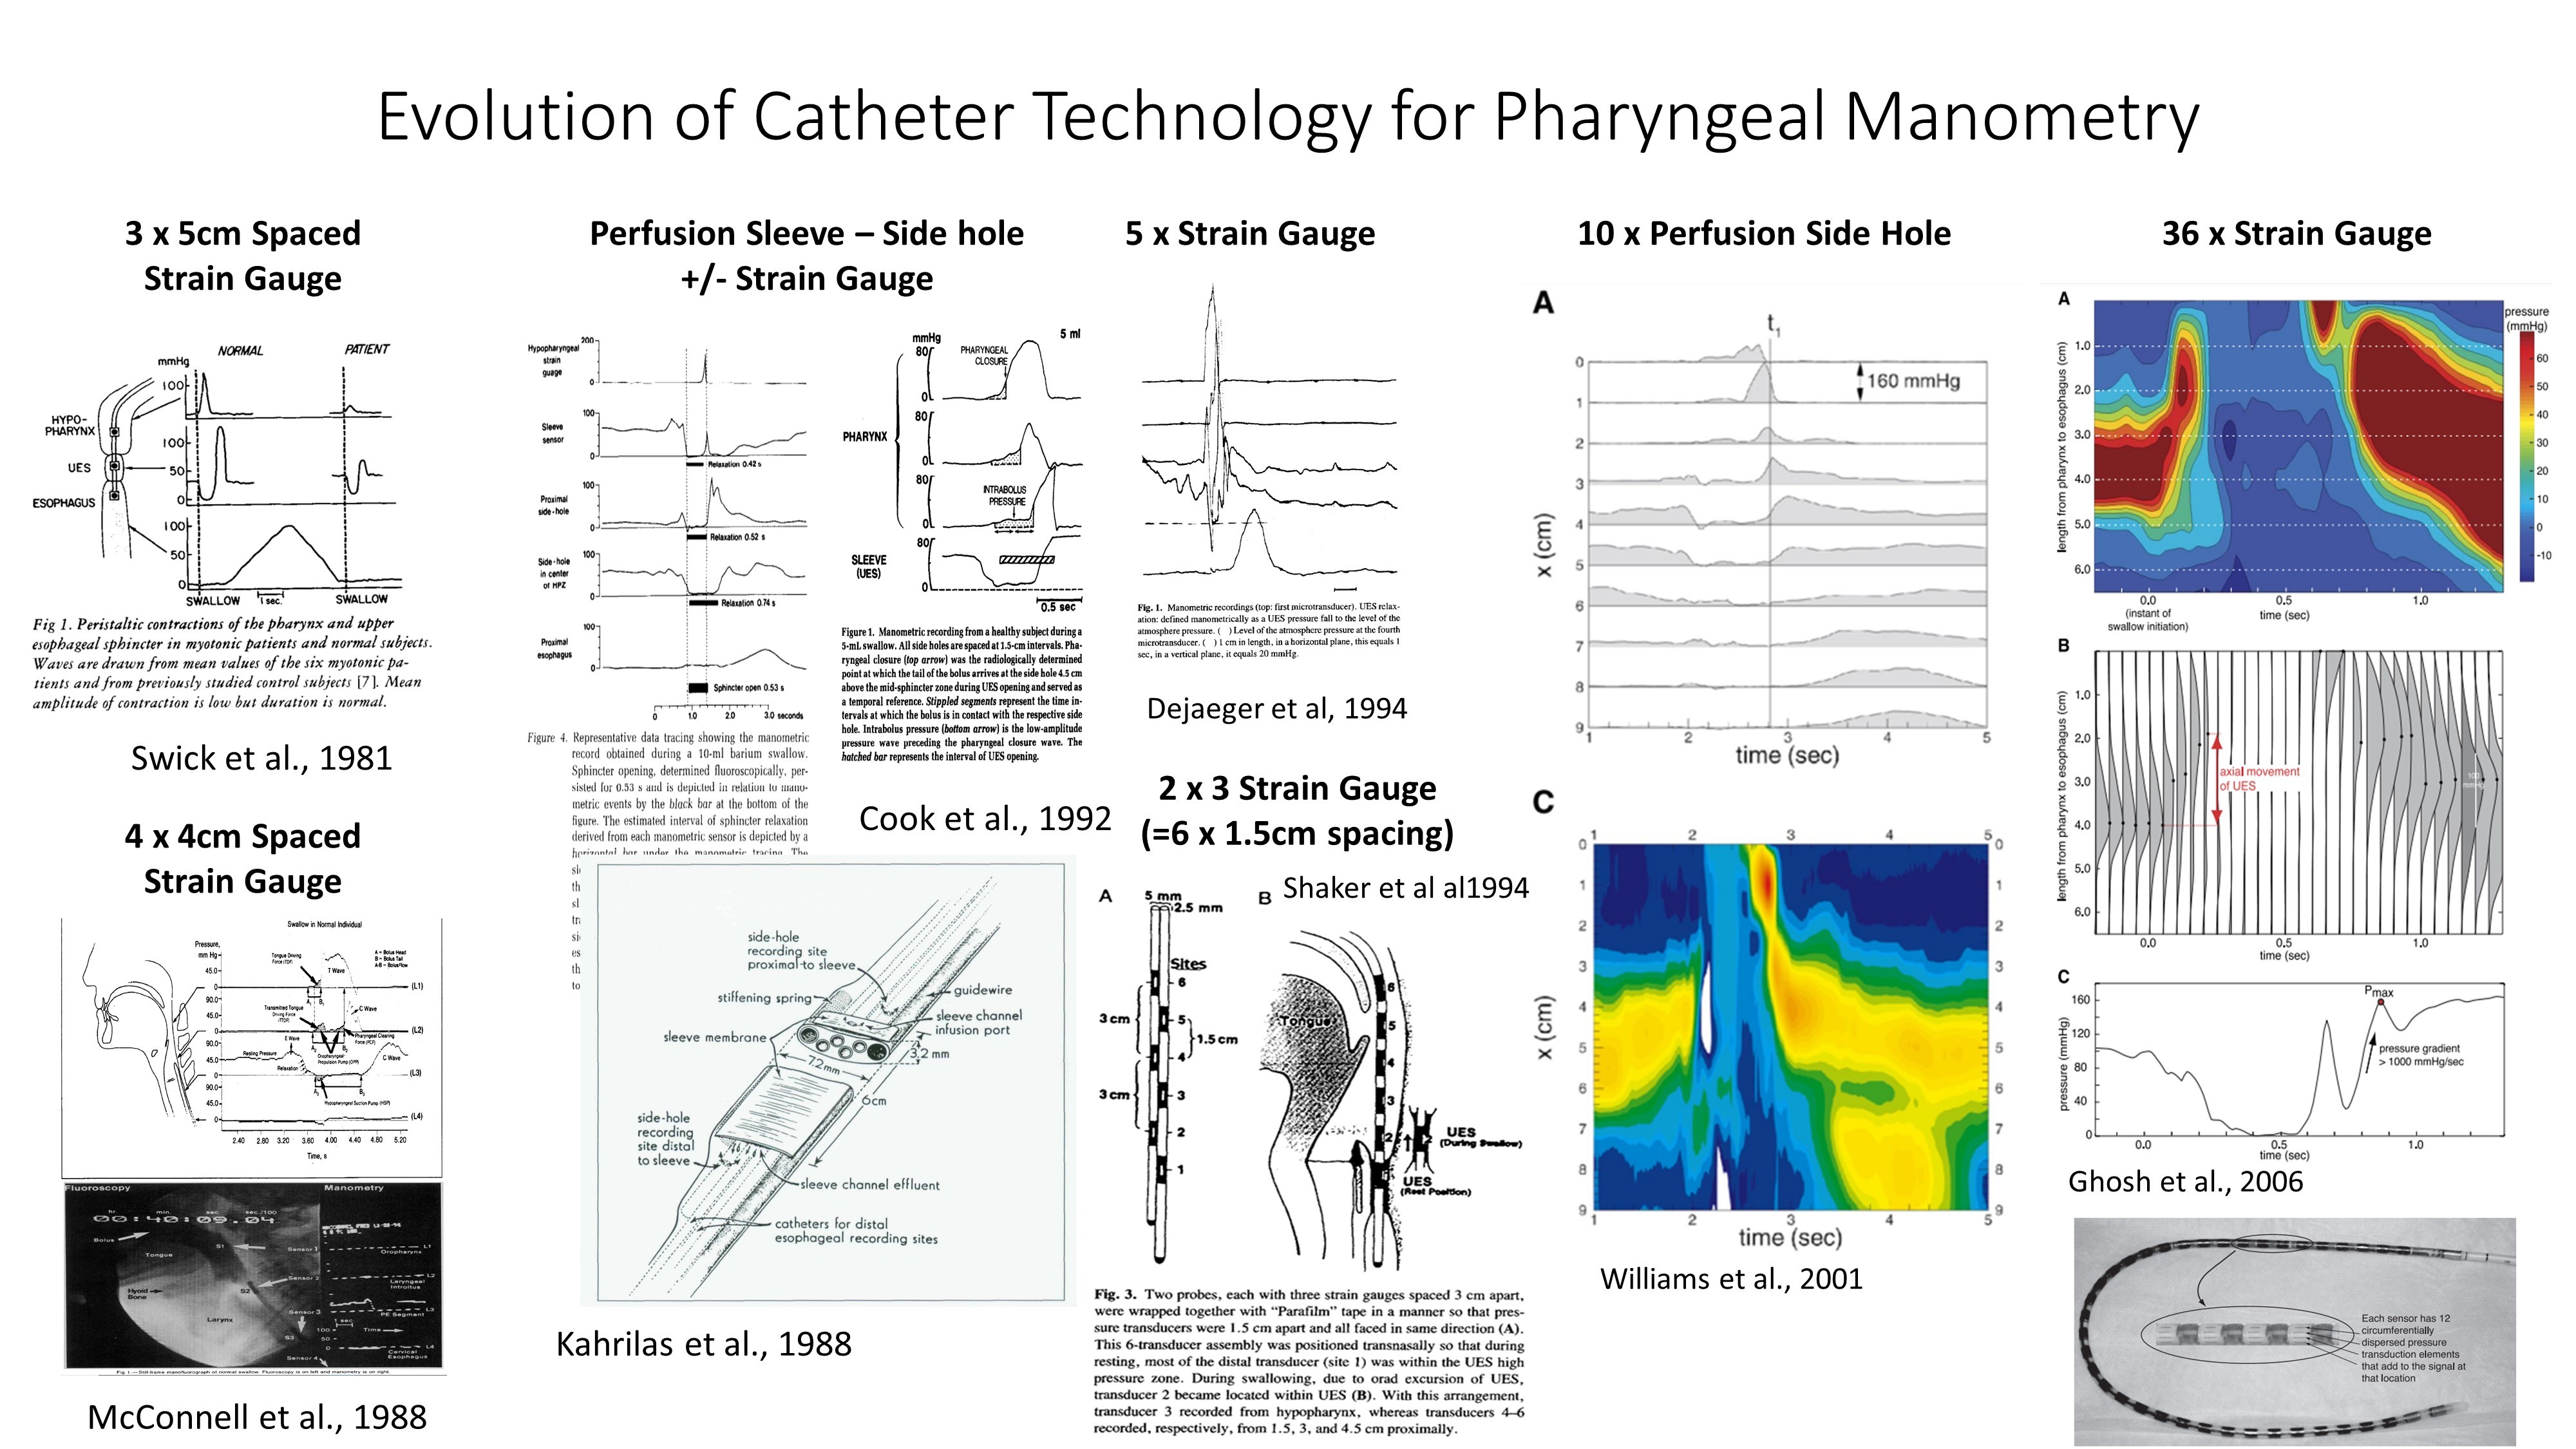
For many decades, investigators have been using manometry to assess pharyngeal motor function. The related technology has evolved considerably; catheters incorporating three, four and five strain gauge sensors were in frequent use in the 80's and 90's and even six channel recordings were achieved by recording from two catheters simultaneously. Water perfused manometry, whilst limited by poor pressure-response times, nevertheless enabled recording of upper sphincter tone and relaxation using the perfused "sleeve" device (invented by John Dent). In the 2000's, perfusion manometry enabled recordings with up to 10 x 1cm spaced spaced pressure sensors leading to the first space-time "pressure structure" maps of the upper esophageal sphincter. This in turn paved the way for solid-state high-resolution manometry with pharyngeal pressure topography, as we know it today.
Why do we need solid-state catheters?
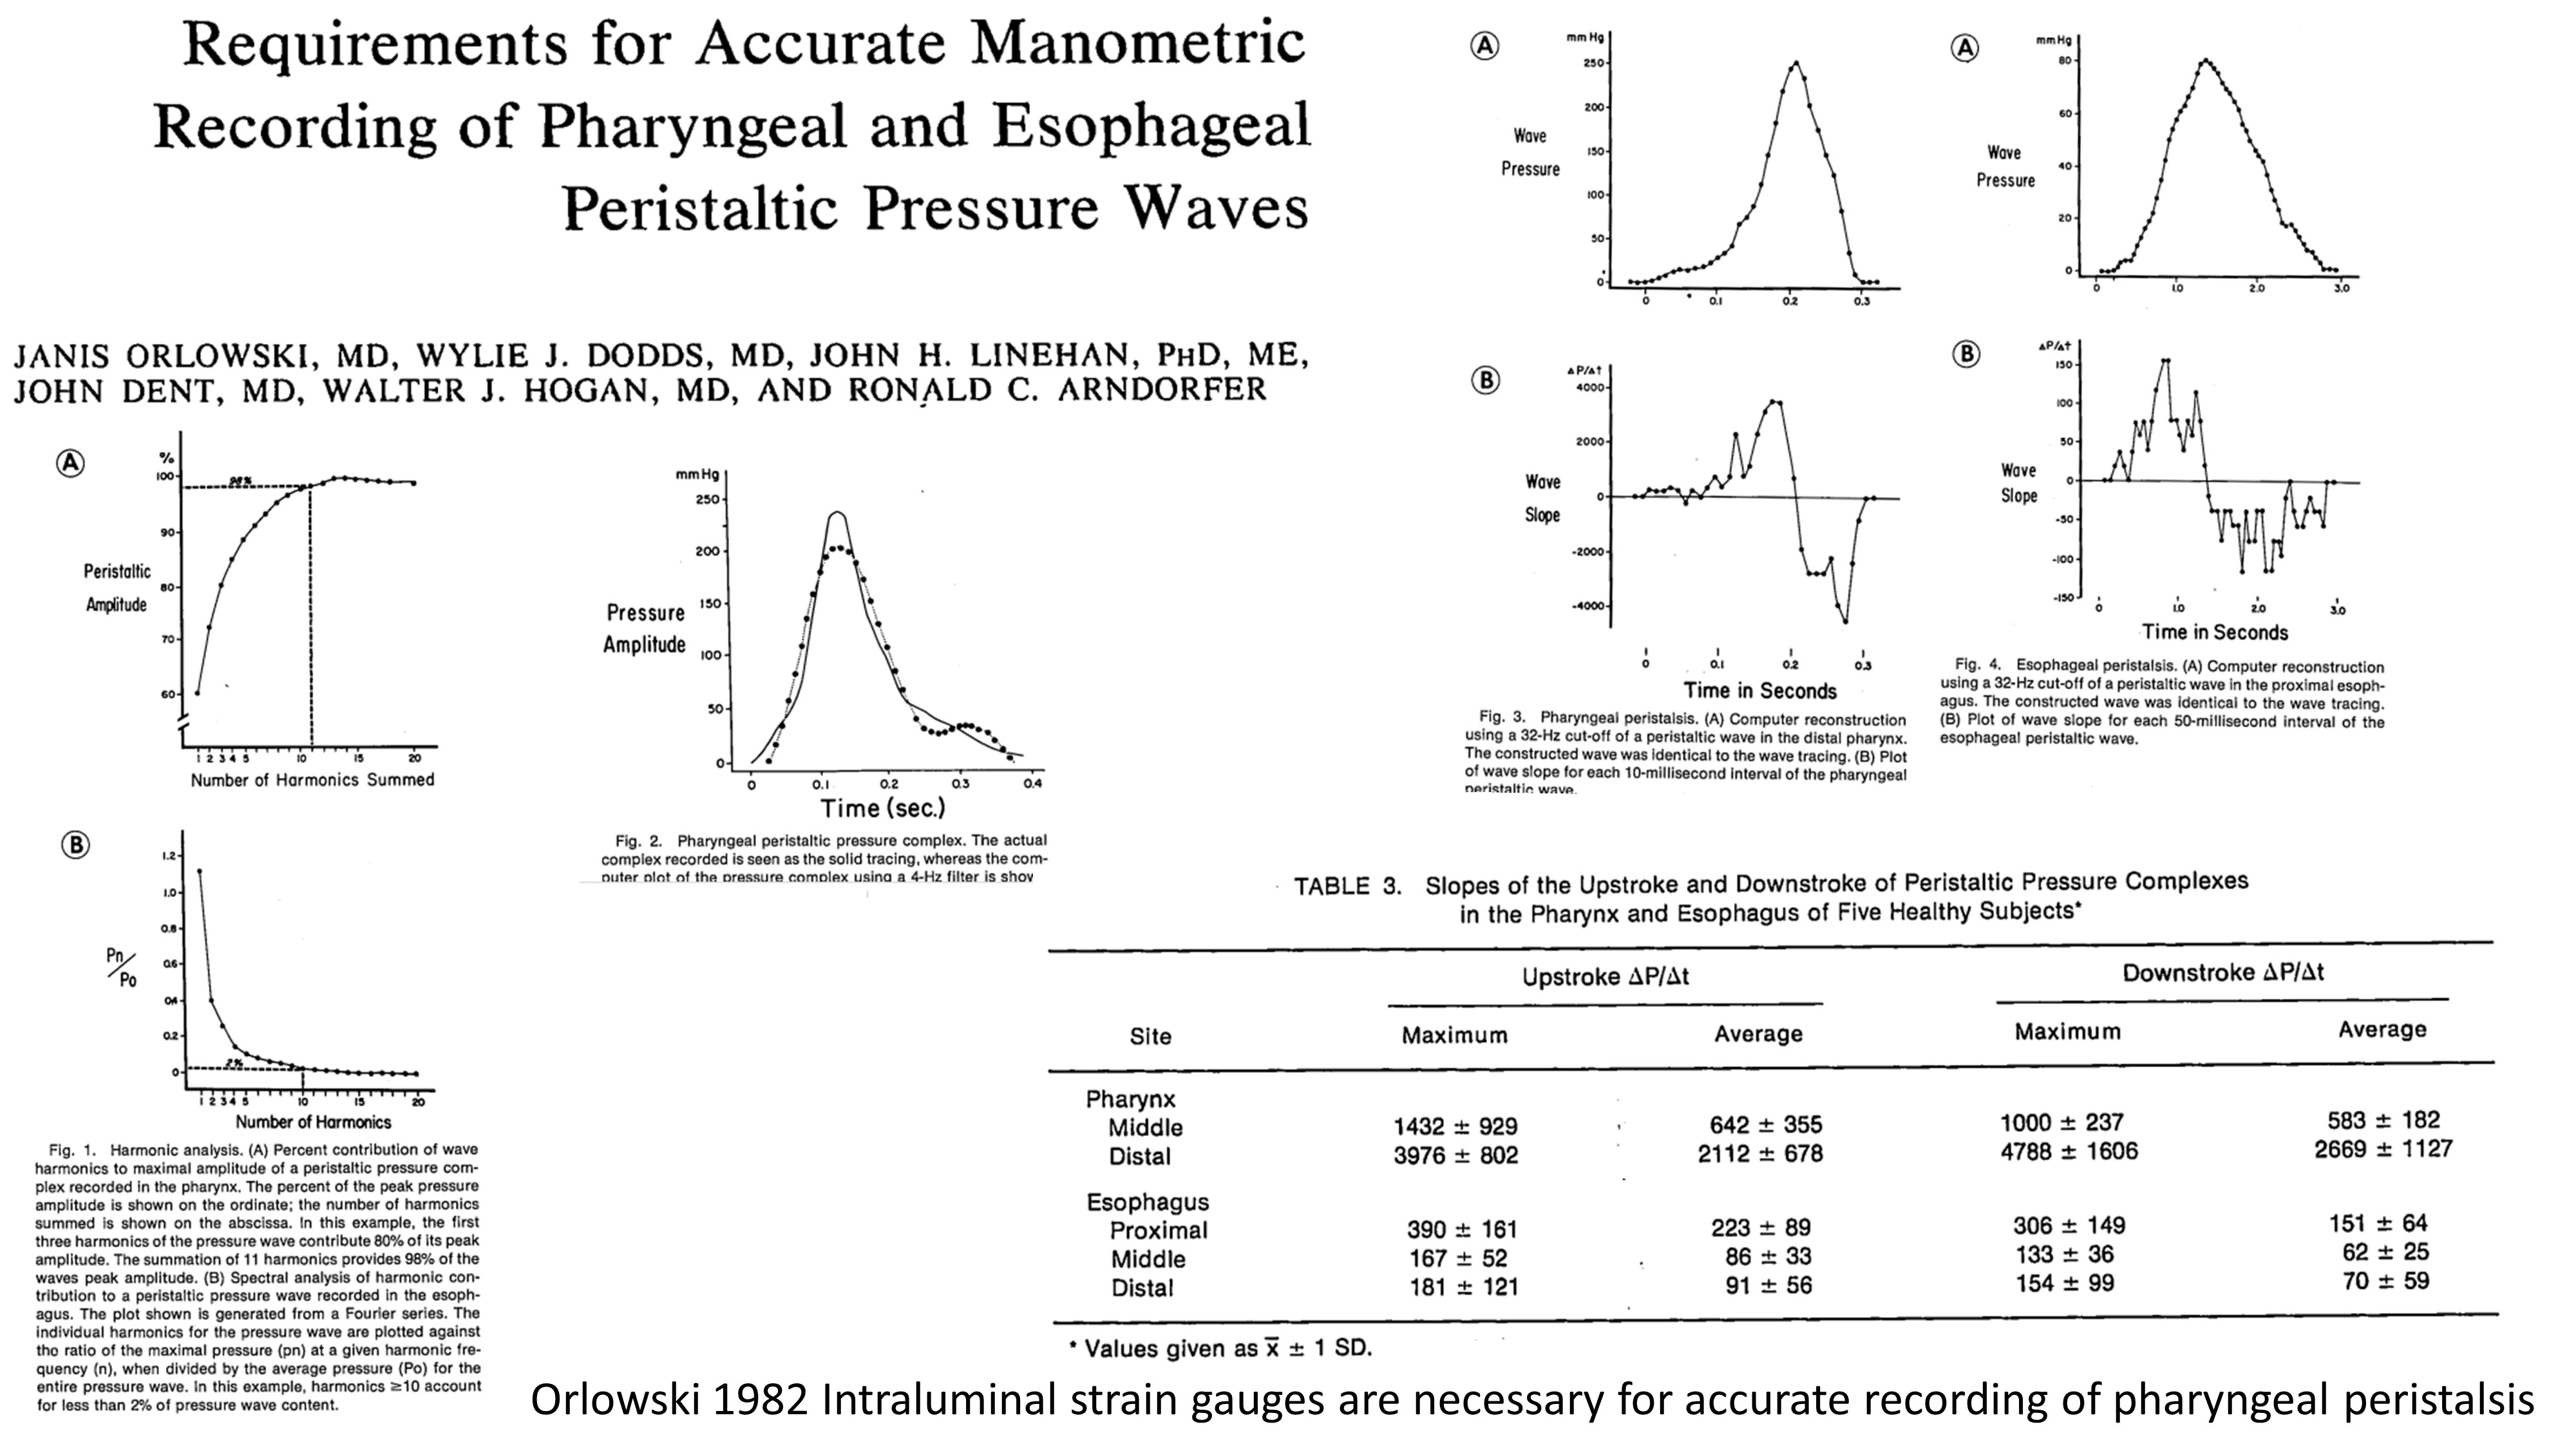
Classic research papers, such as the one shown below, investigated the minimum quality of recording need to faithfully reproduce the upstroke and downstroke of contraction waves generated within the pharynx and esophagus.
This is important because an inadequate pressure response rate will lead to an under recording of maximum pressure generated by muscular squeeze. The pharyngeal contraction forces generated during swallowing are considerable and a catheter placed in the pharynx will typically measure pressures of several hundred mmHg amplitude. In comparison, pressures in the esophagus are lower in amplitude (Figure 3 in below). Across the pharyngo-esophageal segment region, the approximate rate of contraction pressure generation over time averages from 200-2000 mmHg/second (Table 3 in below). This rate vastly exceeds the capacity of perfusion manometry systems which typically have response rates of 100mmHg/second, making solid state manometry necessary for accurate pharyngeal manometry.
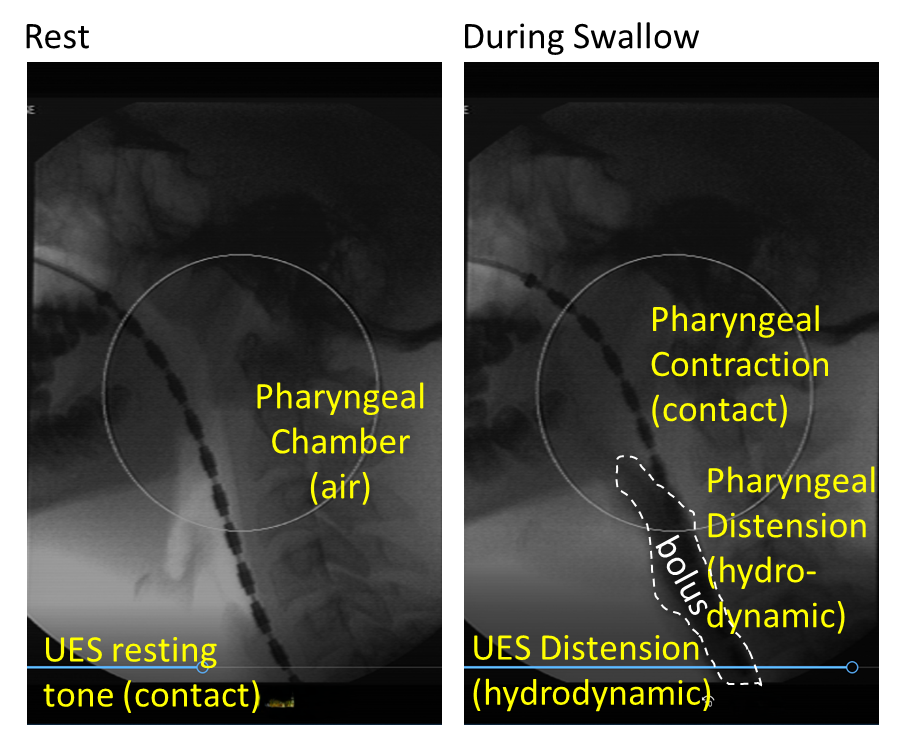
In the x-ray images below, you can see a manometry catheter (with 1cm spaced sensors) within a pharynx at rest and during a swallow. At rest, the pharynx is largely quiescent, and often the only contact pressures being generated are those at the upper esophageal sphincter, which exhibits tonic activity. During the bolus swallow, the pharynx and upper sphincter are distended by the bolus as it transits, generating hydrodynamic pressures. Then the pharynx and upper sphincter will contract behind the bolus, generating contact pressures.
Asymmetry of Pharyngeal Pressure Generation
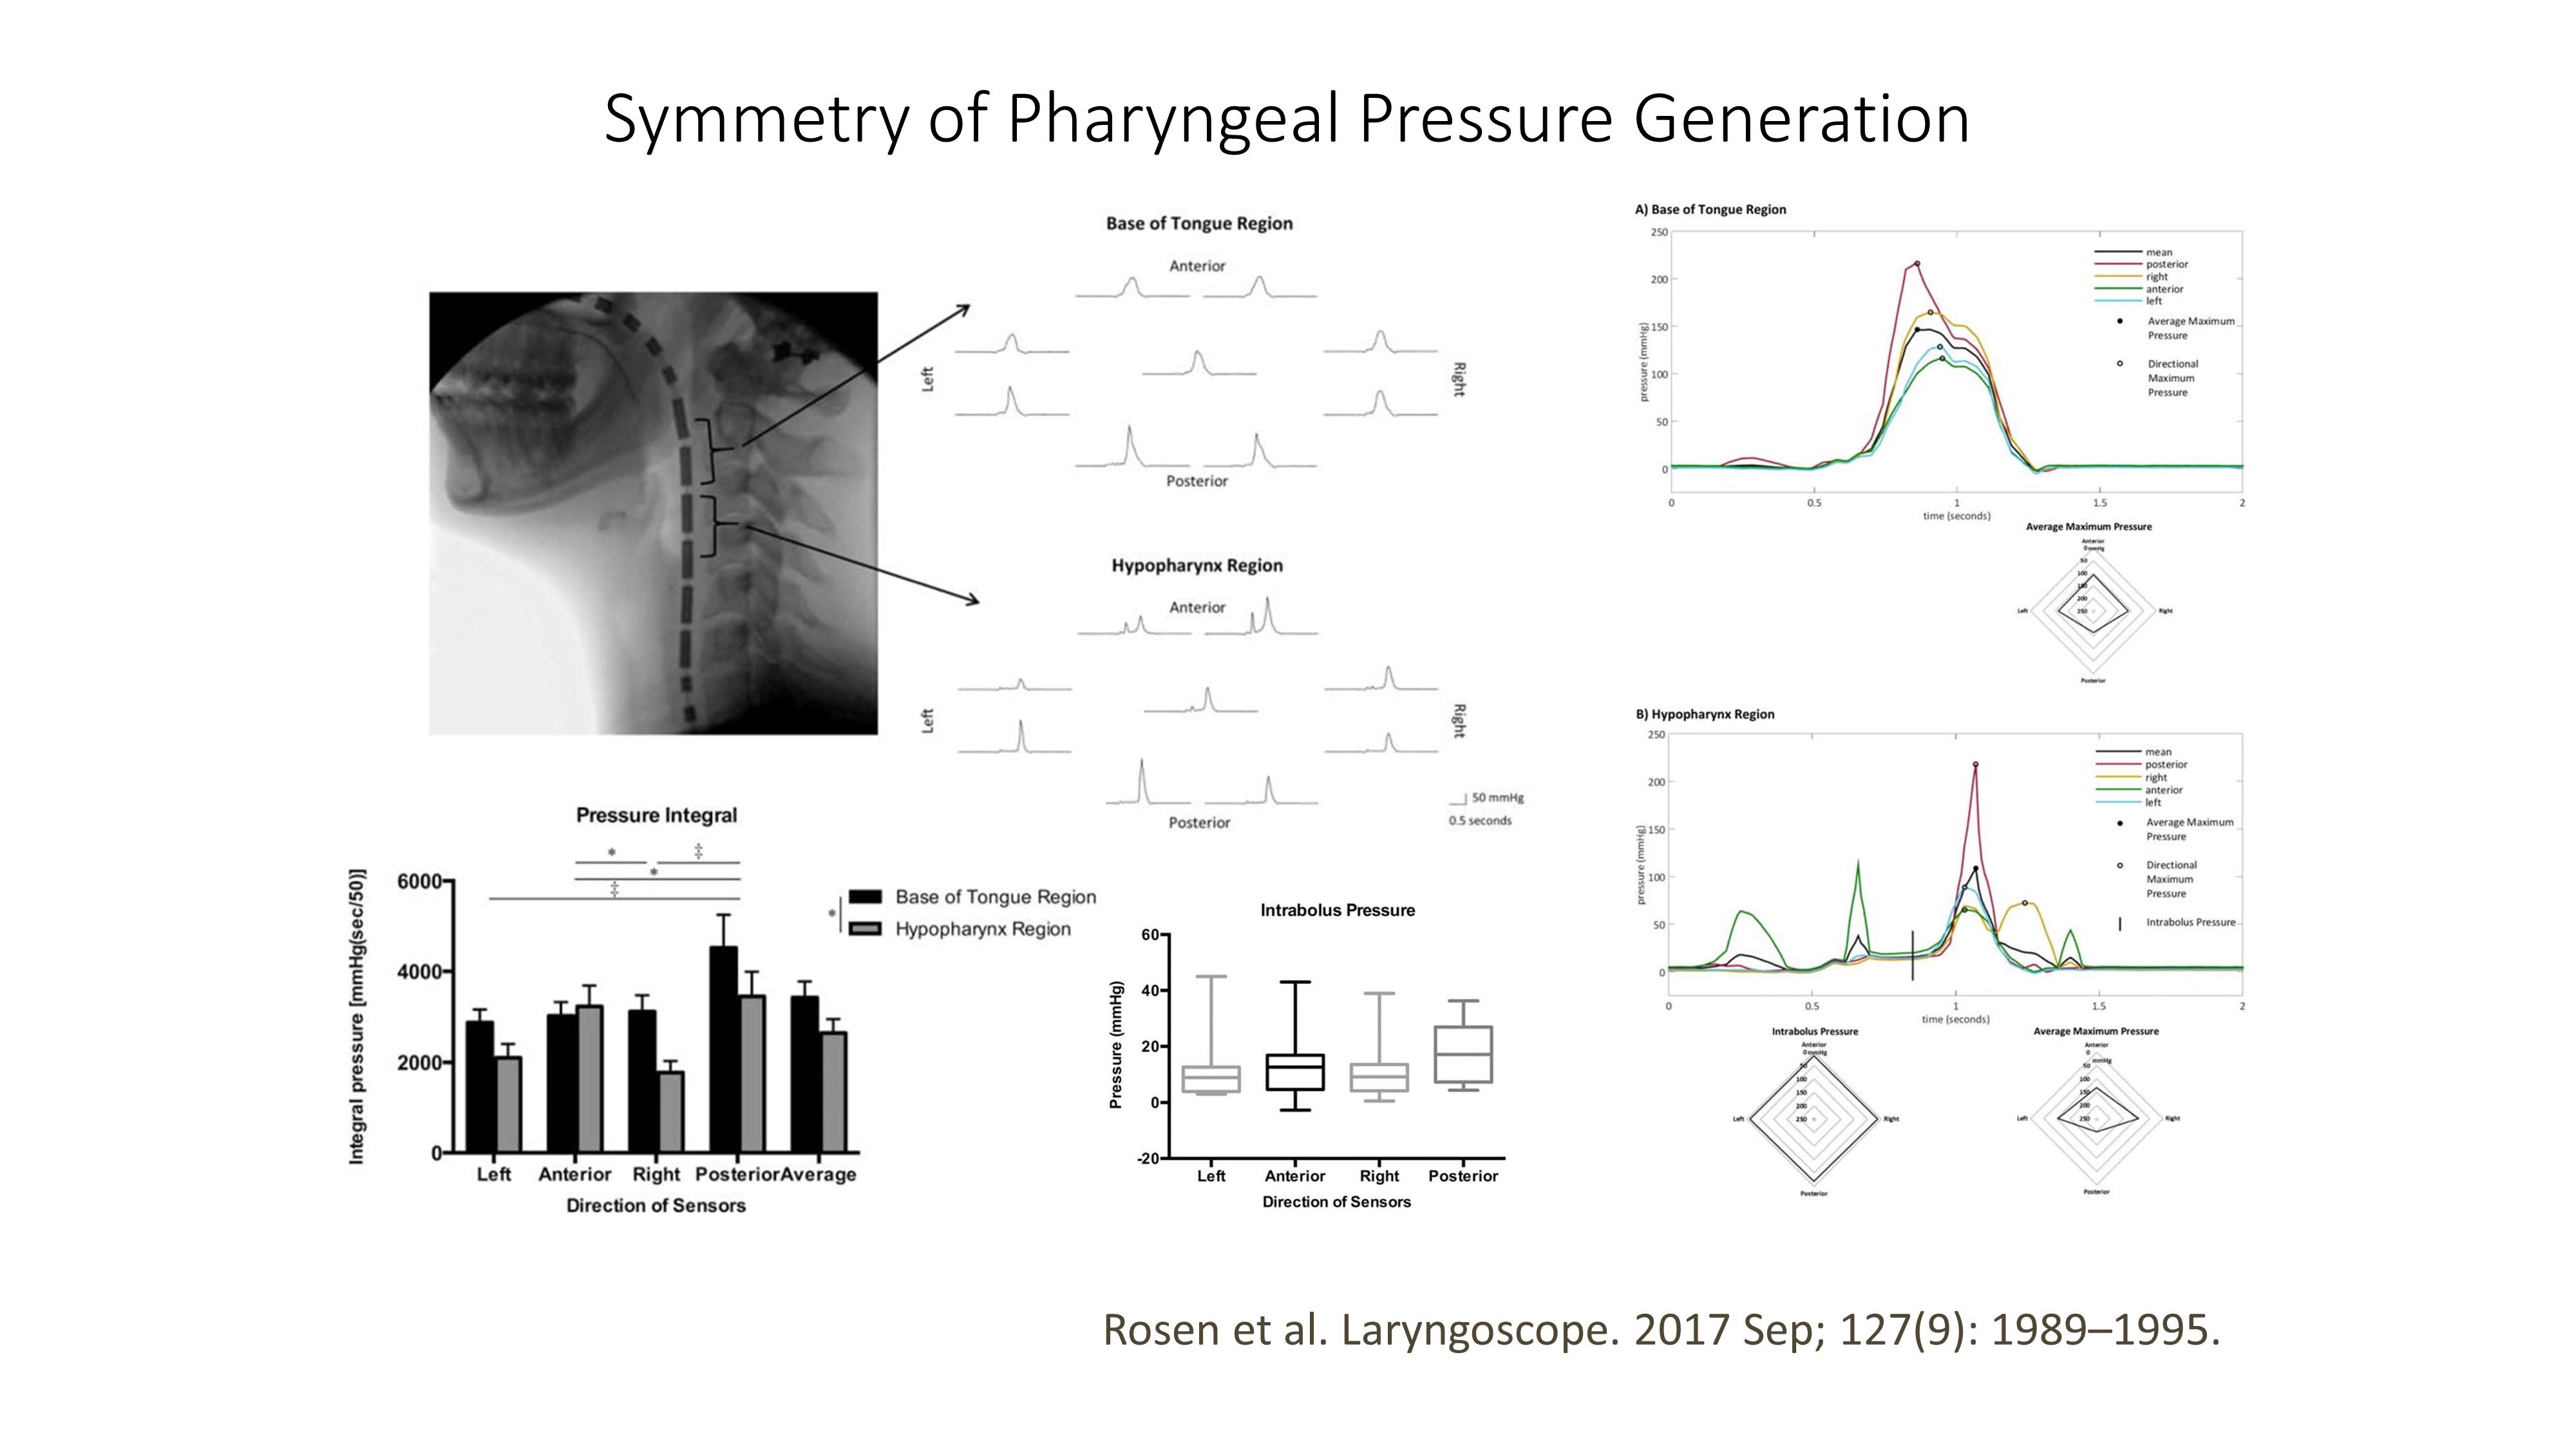
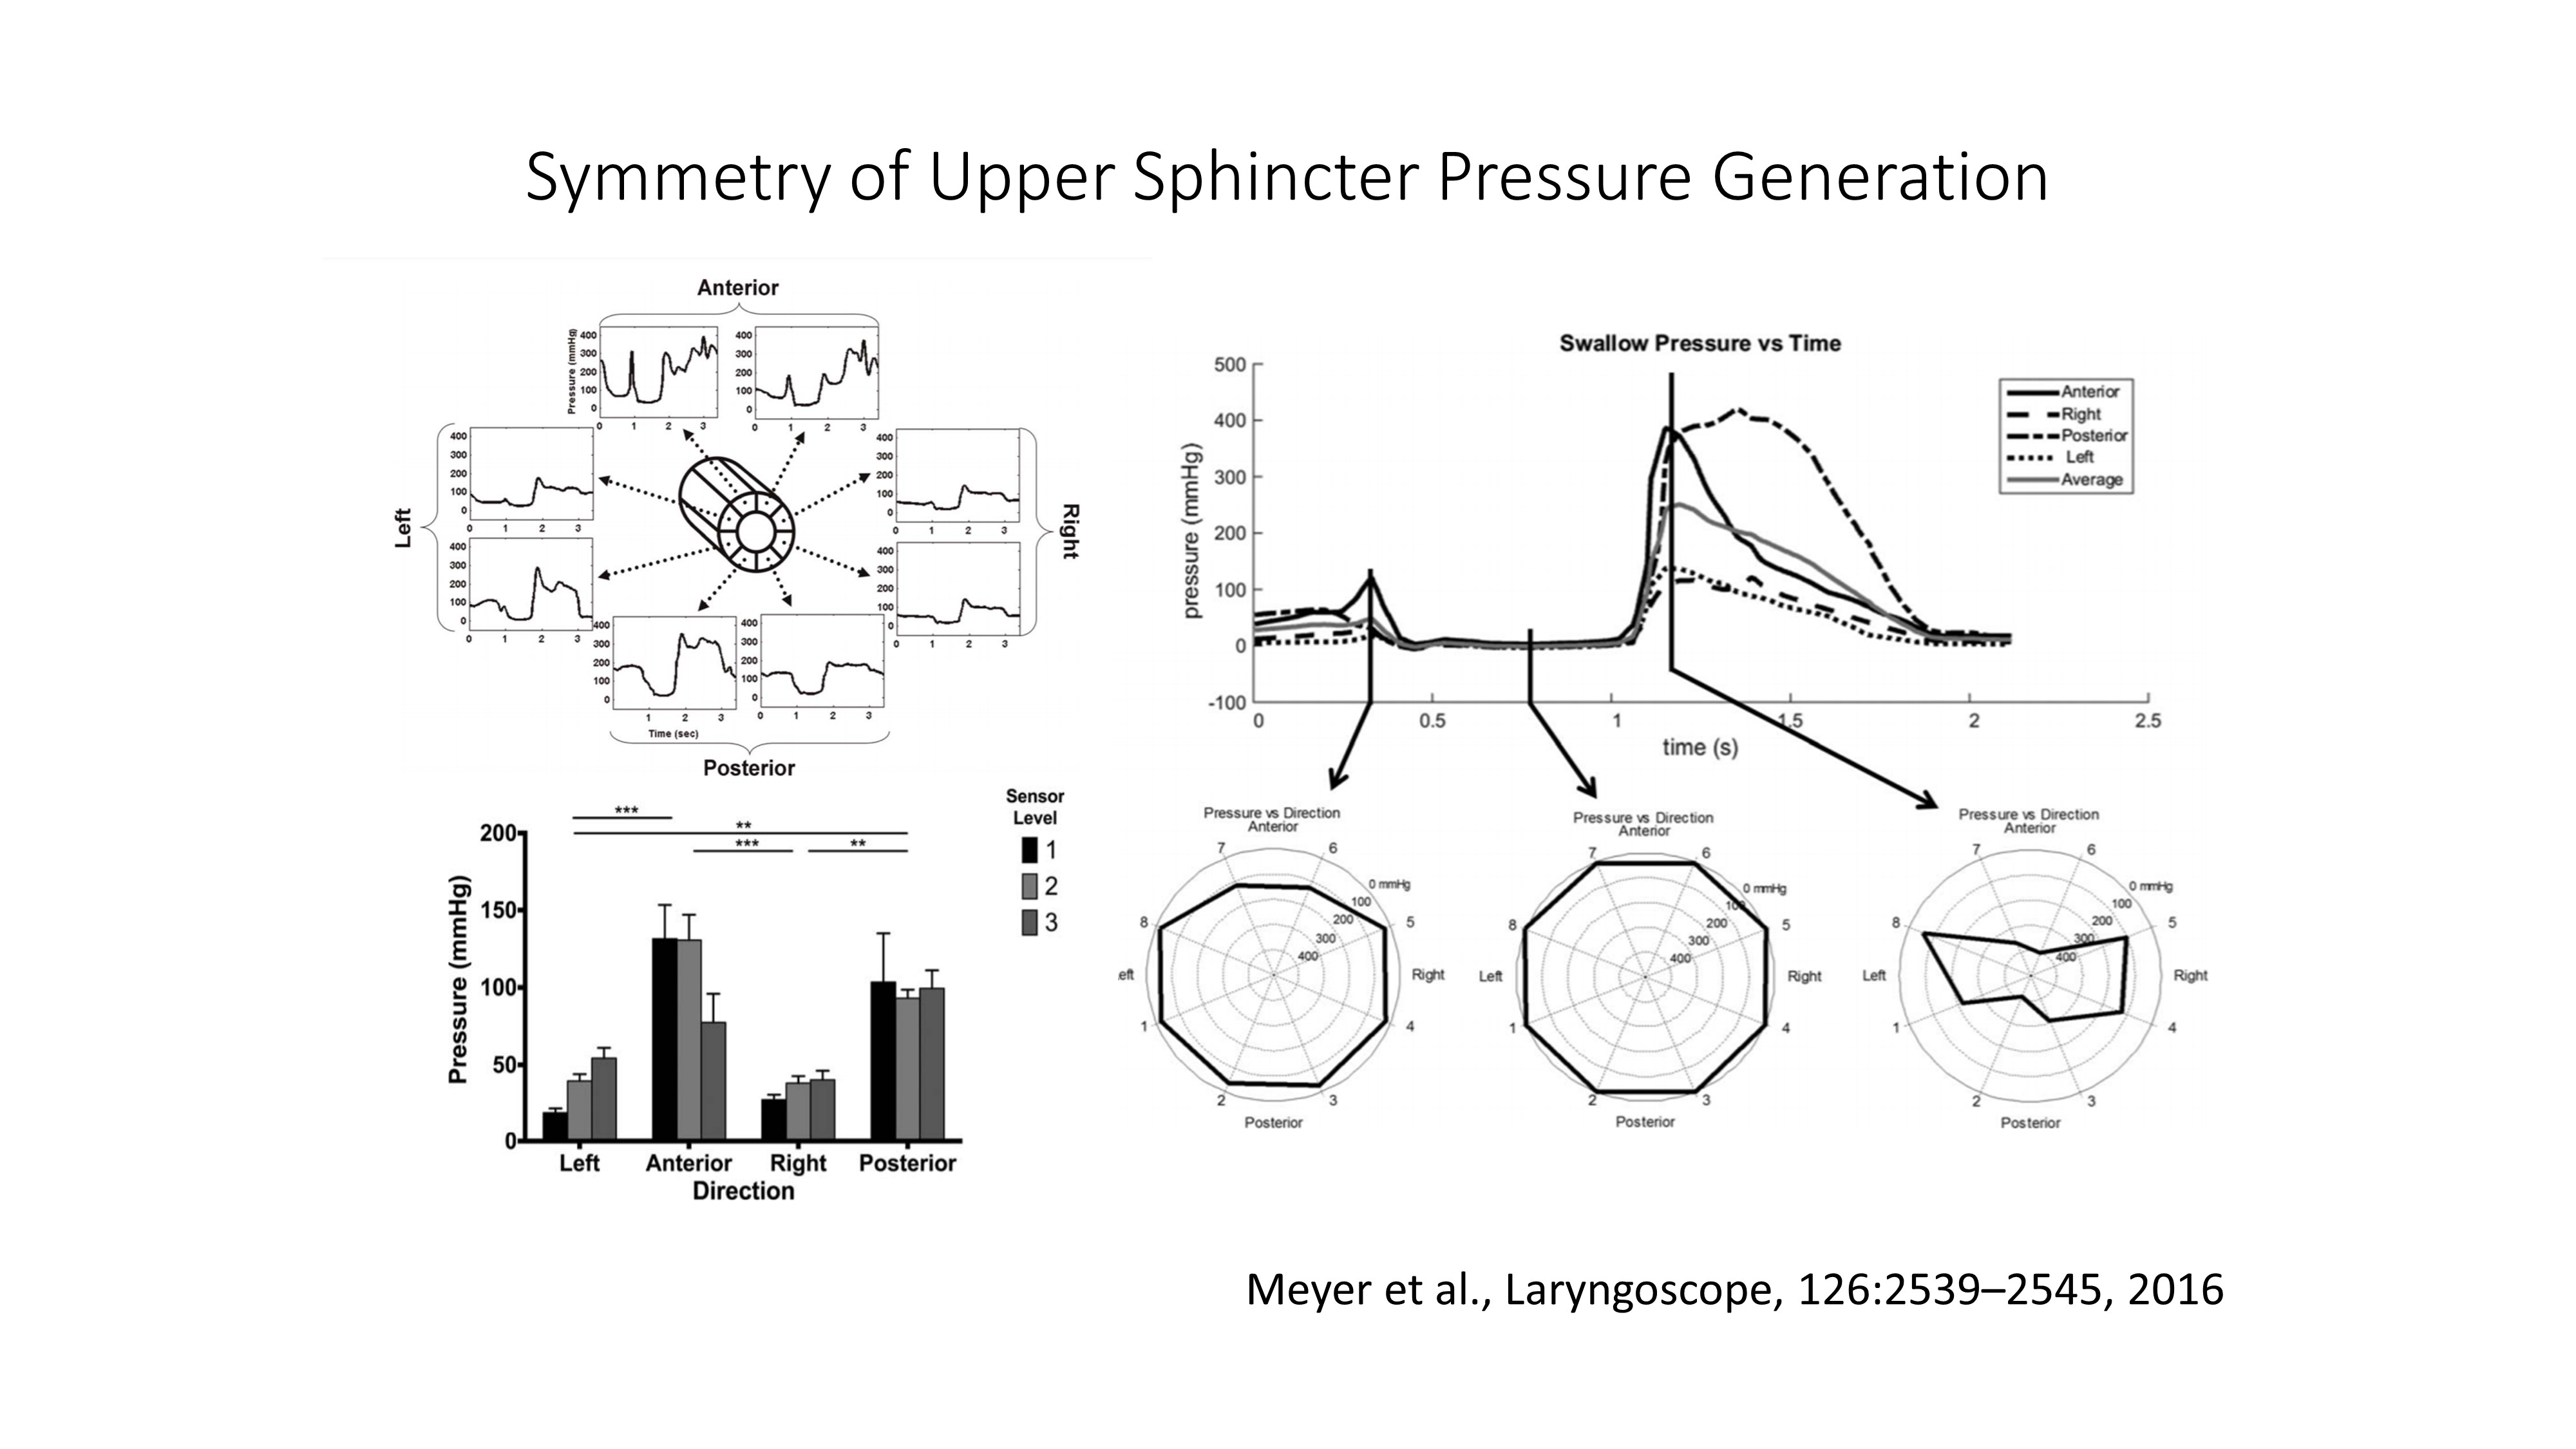
Pressure asymmetry within the pharynx and UES has been known for many decades. More recently it has been possible to measure pressures simultaneously around the circumference of a "3D HRM" catheter. Below are data from two articles illustrative of this asymmetry of pressure generation in the pharynx (top) and upper sphincter (bottom).
This work shows that;
- bolus distension pressures that "push out" and act on the pharyngeal wall are symmetrical, while
- contact pressures that squeeze onto the catheter are asymmetrical, with these contact pressures being higher in the anterior and posterior dimensions.
It is tempting to use these data to argue that circumferential pressure sensing is essential for pharyngeal manometry. However, this oversimplifies an issue which may be a broader problem. Most standard circumferential sensor devices currently in routine use only provide circumferentially averaged results for each sensor, which is not necessarily akin to obtaining multiple separate, radially orientated, readings used to provide the data shown below.
Note: most example figures, cases and recordings provided in this Course have been generated from investigations that were performed using unidirectional sensing technology.
Impedance = Conductivity Measurement = Luminal Area
Intraluminal Impedance is an adjunct modality routinely available to purchase with high-resolution manometry systems. The impedance method was devised by Silny and colleagues as a means of detecting bolus transport without needing X-ray imaging.
Essentially, an electrical current is passed between the individual electrode pairs along the catheter. Based on Ohm's law, when a conductive bolus passes, the impedance to current flow reduces, and this changes the voltage that is measured by the HRM system.
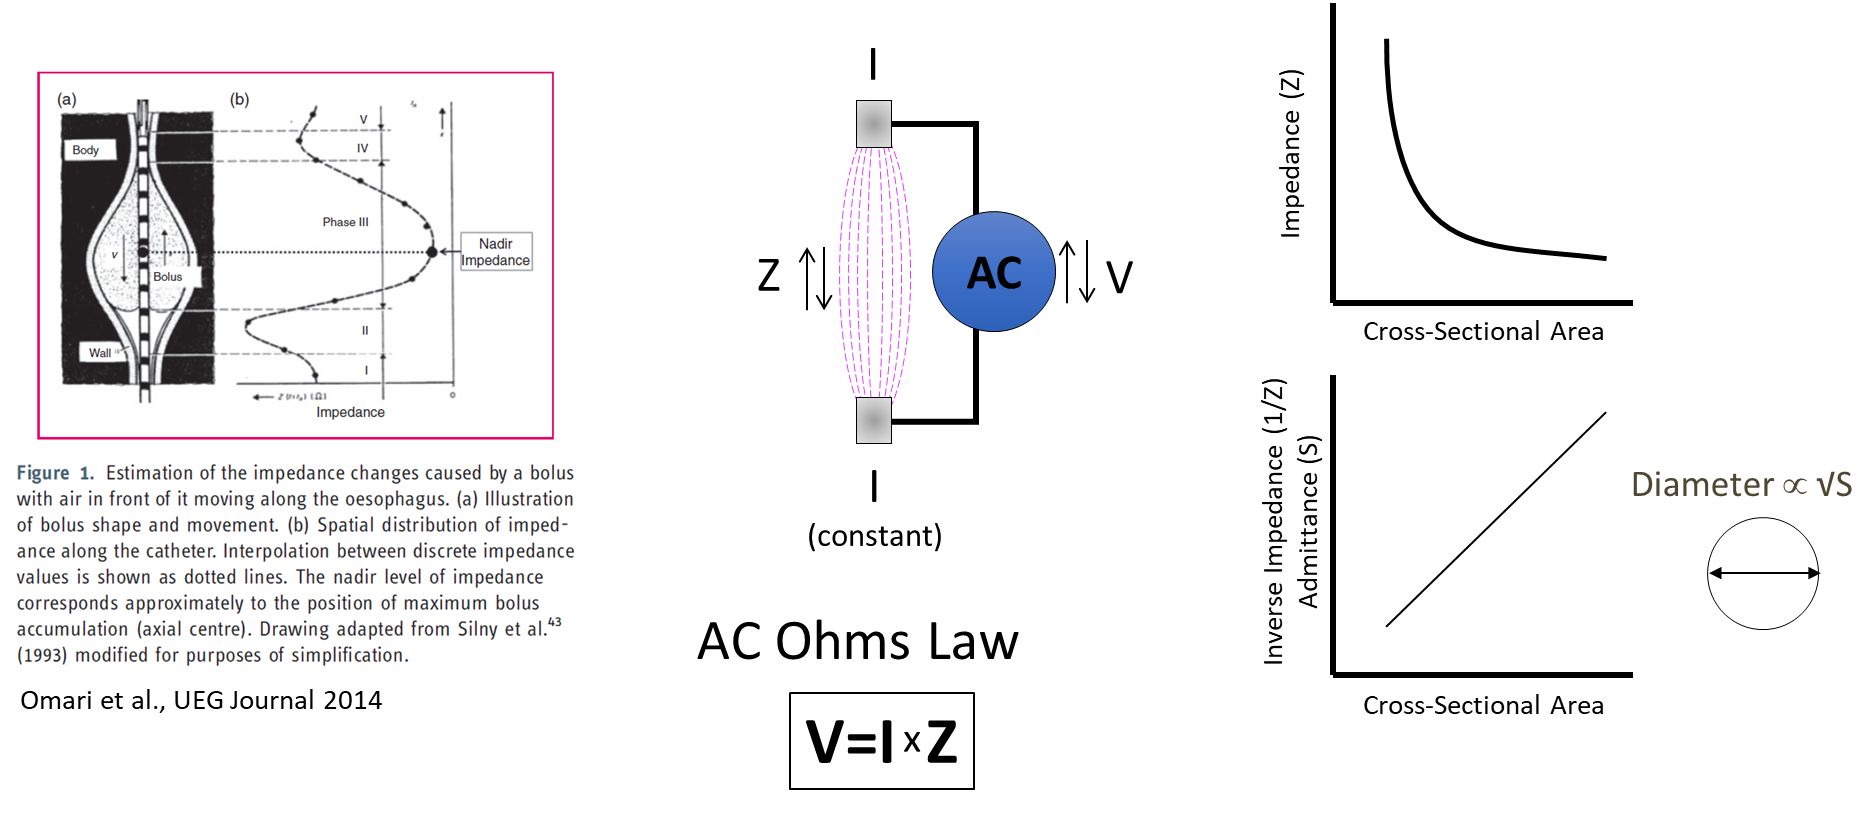
Importantly, the impedance reading indicates both the presence of a bolus and the dimensions (or cross-sectional area) of the lumen. This ability of the impedance measurement to infer luminal dimensions is increasing in importance. It is therefore more typical to display the ohms (Ω) impedance as its inverse product, called siemens (S) admittance. The reason for this is that the signature waveform of the bolus increases in a linear fashion relative to luminal area (see the above graph on the bottom right). This property, in turn, makes visual interpretation of the presence of a bolus more intuitive.
A final point to make is that impedance is measured over electrode segments (usually 2cm long) while pressure is measured at distinct points (usually 1cm spaced). The spatial differences are compensated for by data interpolation; however, it is important to recognise that the two modalities differ in terms of their overall level of precision.

In the video below, you can see what happens when a catheter is placed in a column of conductive solution. Note how the admittance readings increase as the conductive fluid makes contact with the catheter electrodes and then decrease when contact with the catheter electrodes is broken.